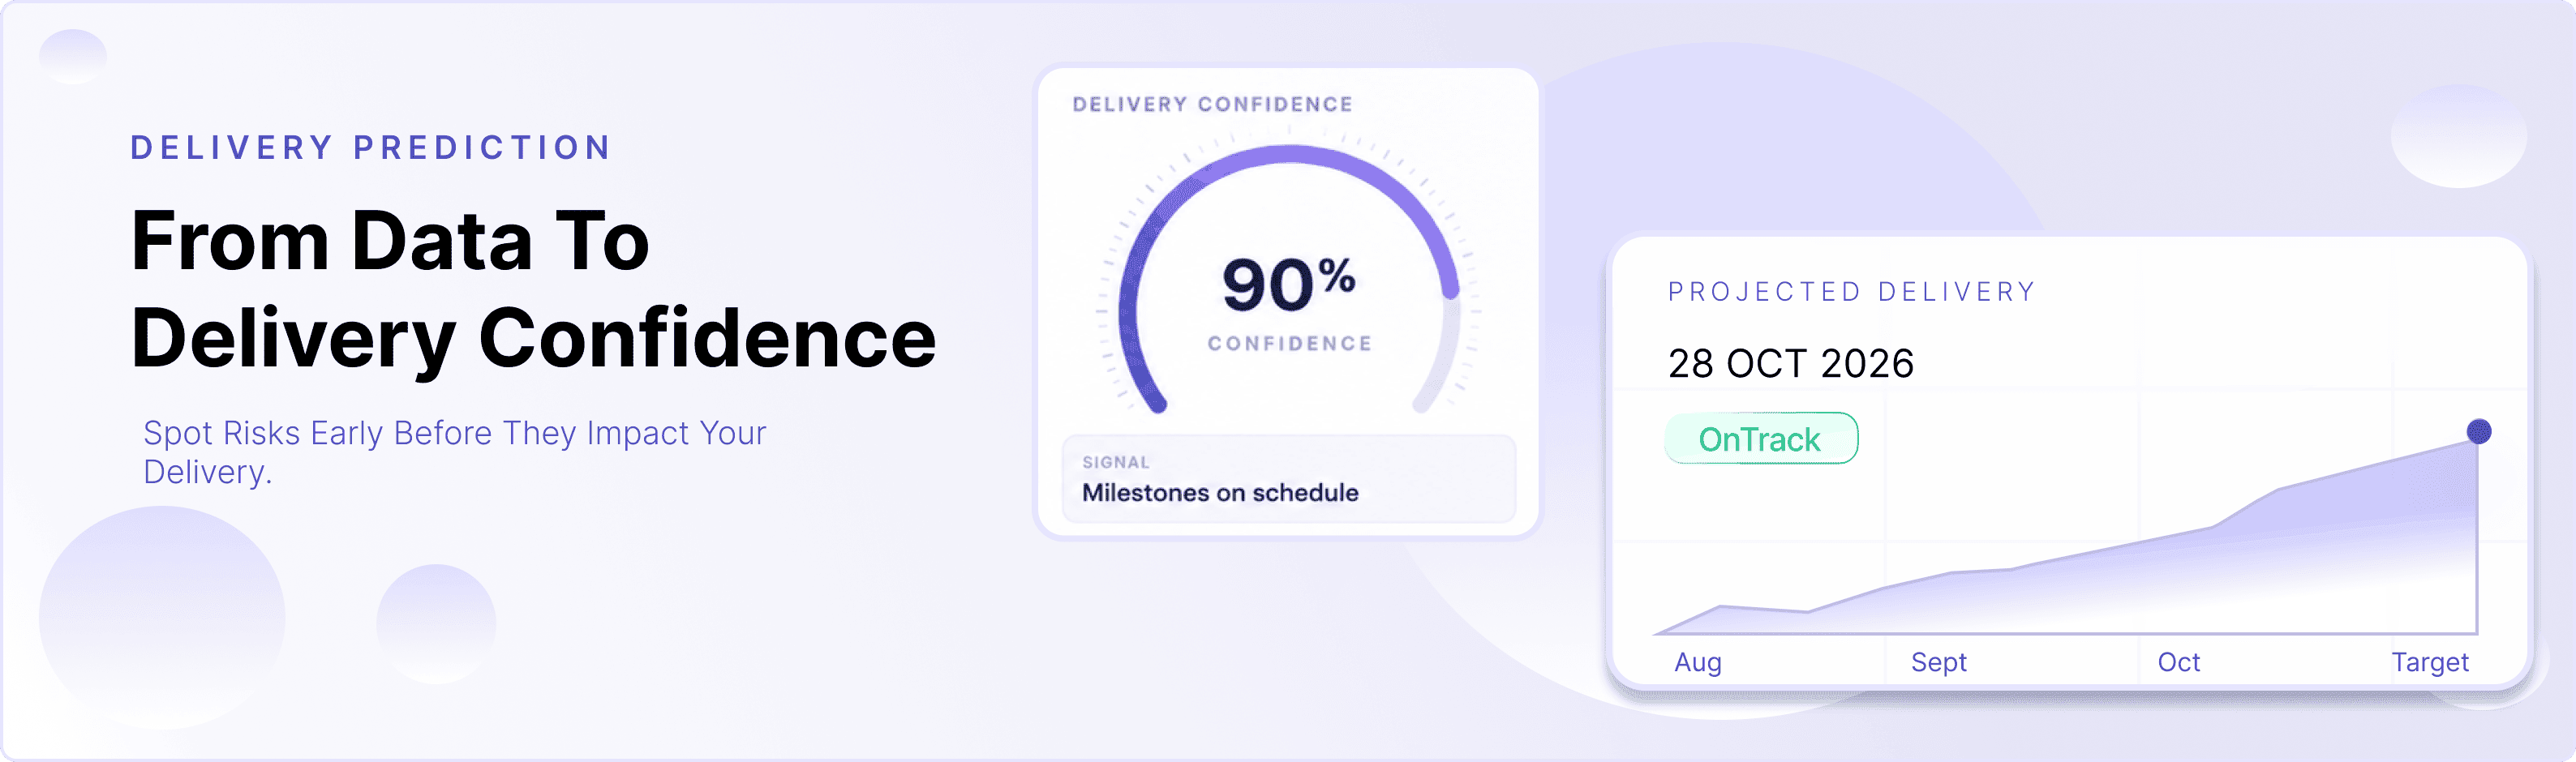
Project Delivery Prediction: A Guide to better Planning
Oct 22, 2026
A guide for Heads of PMO, Delivery Leads, and CTOs/COOs running multi-team projects who want to know early whether their projects are on track, instead of finding out about delays after they happen. It walks you through why delivery is structurally hard to predict, why the early warning signals matter, how a delivery confidence framework works, how the industry has tried to solve this with traditional approaches and how Pragmr OnTime operationalises it inside the modules.
- Delivery Prediction
- OnTime
1. Introduction: What Is Project Delivery Prediction?
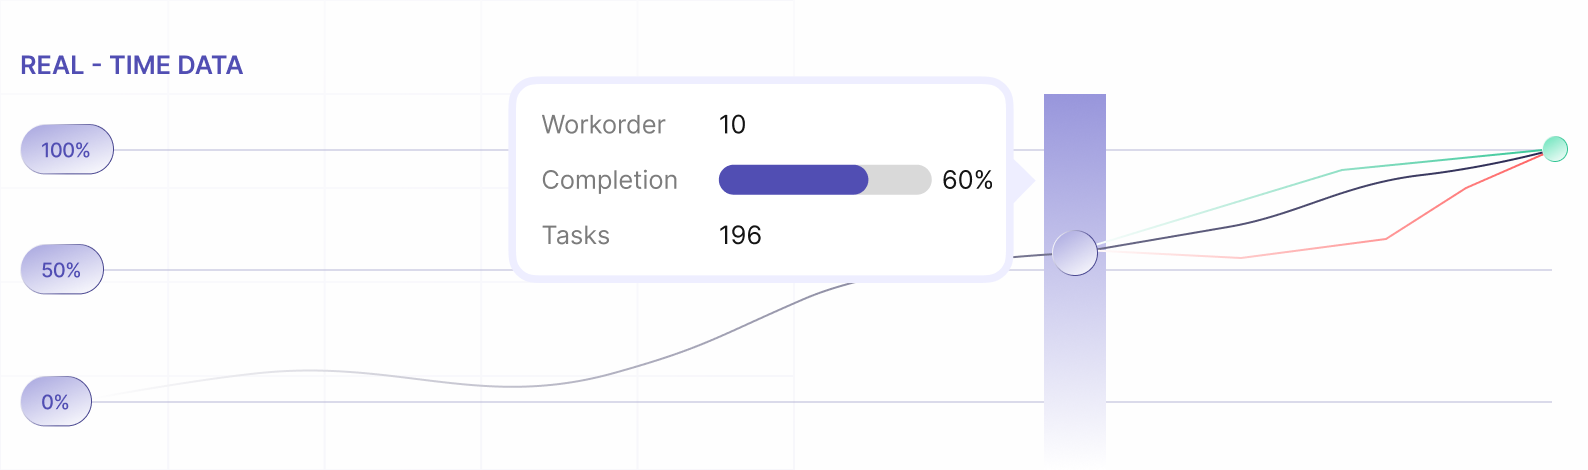
Project delivery prediction estimates completion dates. It uses historical and live project data. Statistical models and machine learning help refine these estimates. It calculates the exact probability of meeting them. As a result, teams no longer rely on manual status updates or gut feelings. Instead, they track velocity, resource allocation, and risk signals in real time. This approach detects project delays weeks in advance. It also moves teams from reactive scheduling into proactive, data-driven decisions.
2. Why Delivery Predictability Matters?
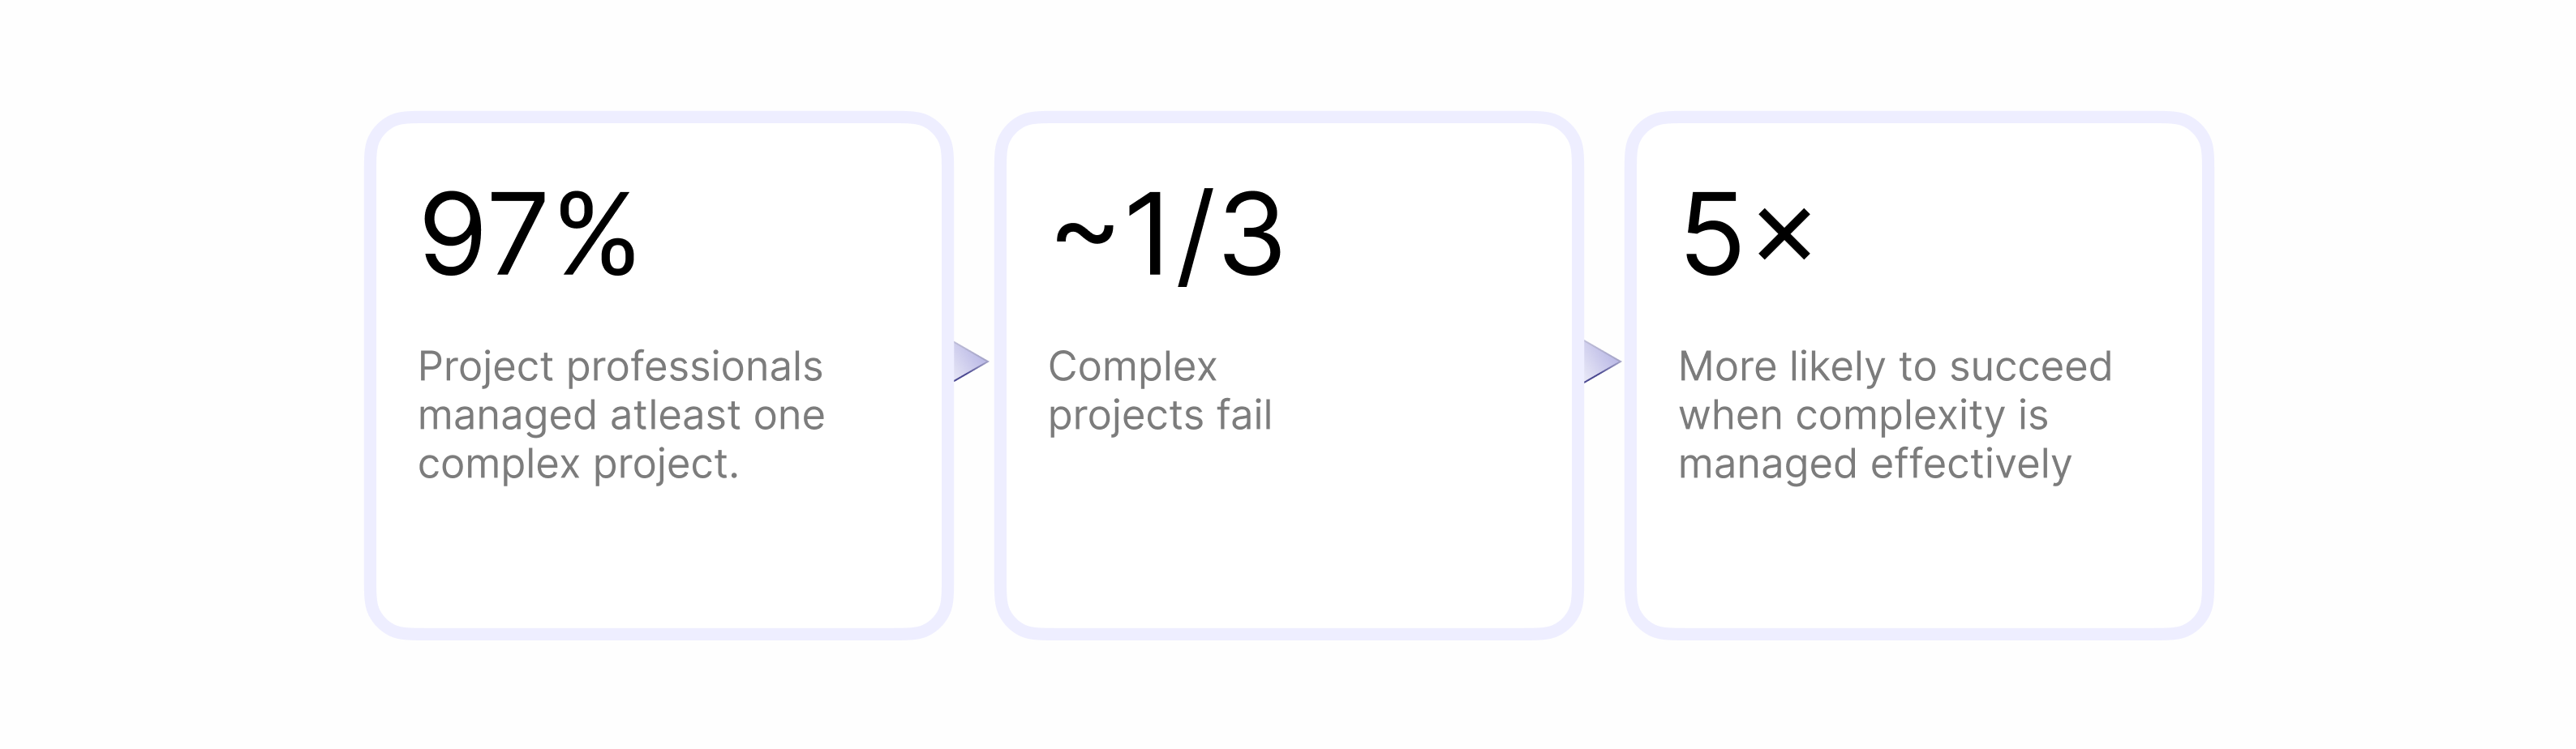
Missed deadlines are common in software and service delivery. In fact, they happen more often than teams expect. PMI’s Pulse of Profession 2026 report shows that 97% of professionals handled at least one complex project in the past year. More than half of those projects were deeply complex. Roughly one in three failed to deliver their full intended benefits. That failure rate is nearly double the rate for simple projects. Still, professionals who handle complexity well are five times more likely to deliver a successful outcome.
This gap shows that success depends on more than pure effort or team quality. Teams also need to spot risks early, before they cause missed milestones. When delivery is unpredictable, businesses face project cost overruns, delayed revenue, and strained customer trust. They also lose market opportunities. In addition, unpredictable delivery leads to rework and can weaken customer retention and renewals. It even pulls leadership focus away from growth and toward fixing delivery issues.
Delivery prediction is not just about project management. It is also a tool for business capability. Teams that spot risks early can adjust before a project milestone slips. This protects margins, maintains customer confidence, frees team capacity, and secures the expected business value.
3. Why do projects become unpredictable?
Most teams build project timelines once and rarely review them after work starts. This is a core weakness, because it undermines estimation accuracy from day one. However, teams often treat the original estimate as fixed, even after assumptions change.
Meanwhile, the project keeps moving. Priorities shift, new project dependencies appear, and team capacity changes. This makes original assumptions outdated. This leads to project scope changes and, eventually, project delays.
Without project delivery prediction, four gaps can make project delivery unpredictable. Consequently, teams struggle to keep deadlines reliable.
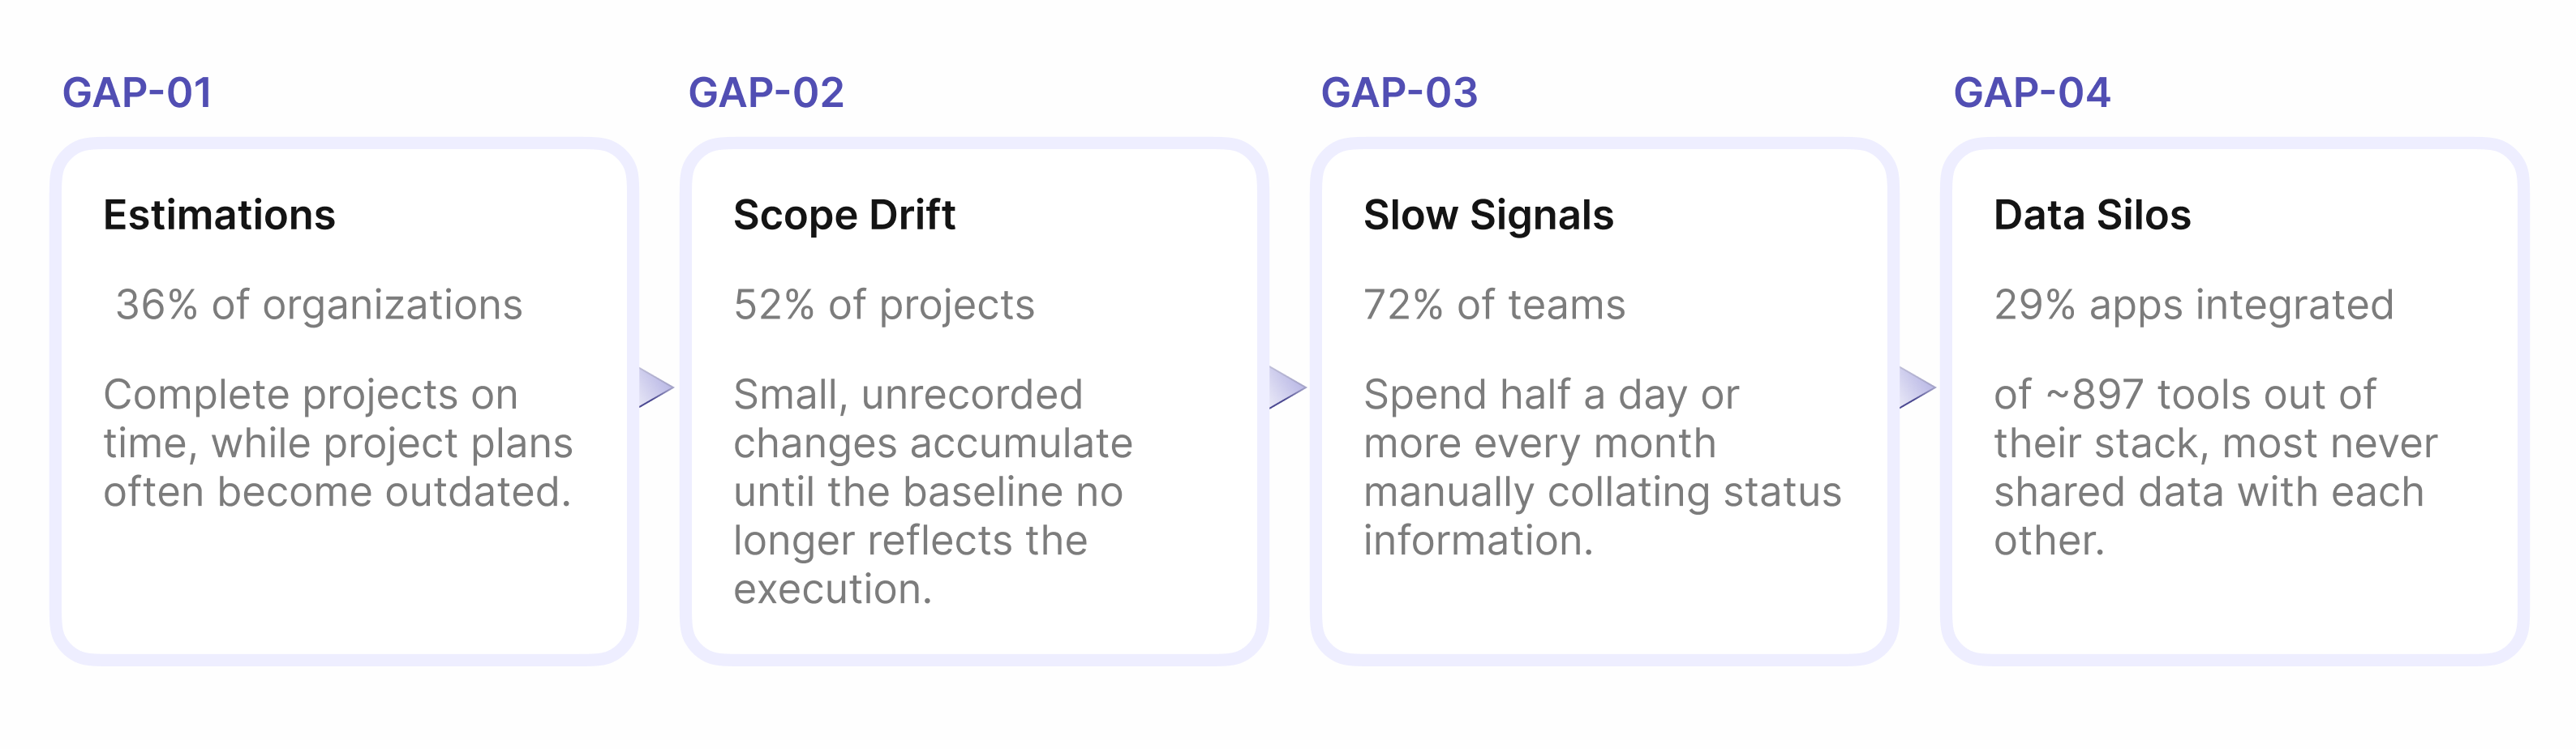
Sources: Wellingtone, State of Project Management 2026 · PMI's 2018 · MuleSoft Connectivity Benchmark 2025
4. How have teams tried to solve this?
Before continuous, data-driven prediction became practical, teams relied on project management techniques with structural limits.
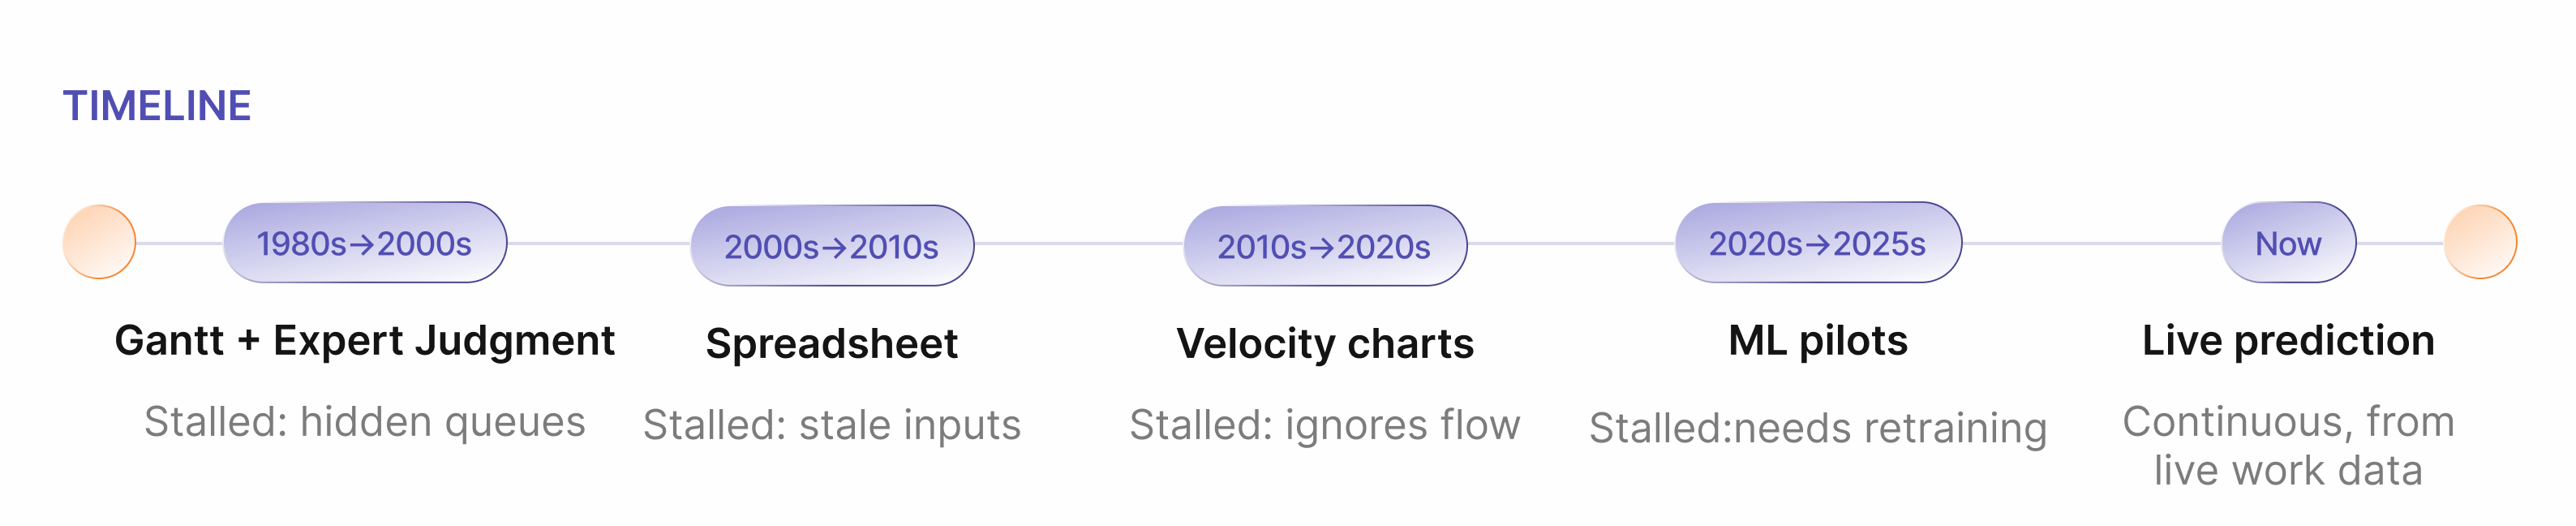
Manual Earned Value Management
How it works:
This compares planned value, earned value, and actual cost to a fixed baseline. It uses CPI and SPI indices.
Why it hits a limit:
- Needs heavy manual data collection
- Assumes a stable baseline
- Updates happen weekly or monthly rather than continuously
Gantt Charts or Expert Judgment
How it works:
Teams map tasks and dates on a timeline and estimate completion based on experience.
Why it hits a limit:
- Misses hidden queues and wait states throughout execution.
- When scope, dependencies, or execution change assumptions become stale very quickly.
- High completion percentages can hide major delays waiting in upcoming tasks.
Spreadsheet Monte Carlo simulation
How it works:
A spreadsheet runs thousands of simulations using best, likely, and worst-case task estimates to predict project completion.
Why it hits a limit:
- Requires dedicated human effort to update data continuously
- Duration shifts continuously once real work begins
- Teams often build models at project startup and then abandon them
Velocity Charts alone
How it works:
The team tracks how much work it finishes in each sprint, then uses that average pace to estimate when the remaining work will be done.
Why it hits a limit:
- Ignores flow efficiency, blockers, WIP, and dependencies outside the team
- Velocity only tracks past output speed. This makes it unreliable for predicting a project's final end date
ML for prediction
How it works:
Uses past project data to predict completion dates and delivery risks by identifying patterns.
Why it hits a limit:
- Requires a large volume of clean, consistent historical data
- Predictions can be difficult for teams to understand or verify
- Models may lose accuracy if processes, teams, scope, or data patterns change. They need regular checks and updates
The Common limitations of the traditional approaches
Although these approaches use different methods, they share a common failure mode: a person designed them to be re-run periodically, so the forecast is only as fresh as the last manual update. Scope, staffing, and dependencies now change from week to week.
5. What Makes Delivery Prediction Possible Today?
Project delivery prediction combines historical data with current project data. Pragmr OnTime uses this data to help teams understand progress, identify potential delays, and estimate likely completion.
Project performance indicators help teams evaluate execution progress, workload, and potential delivery risks.
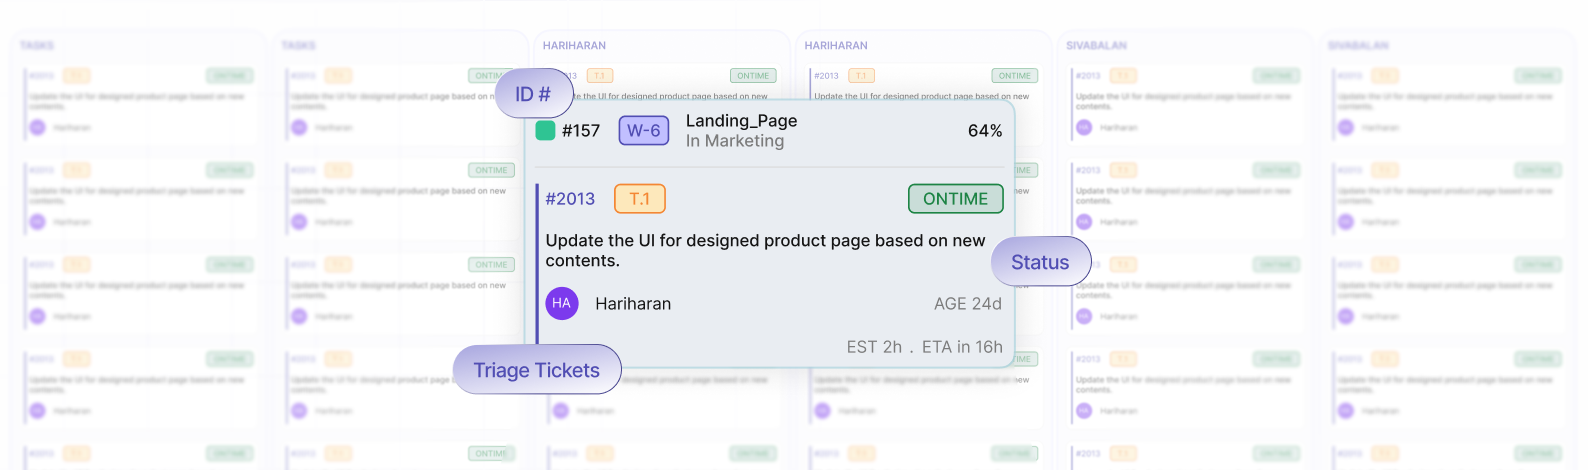
Live Project Data
Pragmr OnTime keeps track of the data generated as teams plan and do their work. This helps with daily project monitoring in:
- Plans and Work Orders: Track core project structures and deliverables
- Tasks and task status: Monitors real-time task movement and execution updates
- Kanban progress: Visualizes workflow stages and active status changes
- Time spent and task estimates: Compares logged hours directly against baseline expectations
- Dependencies, reviews, and approvals: Flags waiting periods and external decision points
- Milestones and due dates: Tracks key target deadlines across the project timeline
- Team skills, capacity, and availability: Evaluates resource workloads, skill fits, and schedules
Delivery Prediction
Pragmr OnTime combines current project activity with historical statistics from similar projects. This helps to update delivery timelines and adjust project scheduling as new information emerges.
It considers:
- Time spent compared with the original estimate
- Task progress and remaining work
- Cycle time for similar completed tasks
- Aging tasks and blocked work
- Work in progress, rework, and dependencies
- Milestone progress and schedule changes
Likely Completion
The result provides a more realistic view of when the task, work order, milestone, or project is likely to be completed.
This helps teams to:
- Identify work that needs attention
- Clear reviews, approvals, and dependencies
- Adjust priorities, assignments, or scope
6. Early Warning Signals of Delivery Risk
Delivery risk rarely appears out of nowhere. Project risk analysis helps teams identify early warning signs. For example, it tracks delayed tasks, overloaded team members, and blocked dependencies. As a result, you can take action before milestones slip.
Common early warning signals include:
- Progress below plan: Completed work falls behind expected progress
- Effort rising faster than progress: Workers log more time, but they accomplish less due to rework or blockers
- Blocked work and stalled dependencies: Tasks get stuck in review or pending states for too long
- Limited team capacity: A team member has little capacity left due to unplanned leave, competing priorities, or overwhelming workload
- Skill gap risk: Someone without the right training gets the work. This can lead to poor output, high error rates, and delays
- Process Bottlenecks: Too many handoffs create “waiting time.” The project sits idle, and each handoff adds a risk of miscommunication
- Too much work in progress: Too many items are open at once. This causes context switching and slower throughput
- Rework Indicators: Unclear requirements, late scope changes, defects, incomplete testing, or late feedback
- Milestone slippage trends: Frequent small delays in intermediate milestones. Consequently, these shifts in your Milestones history and status point to a larger issue with estimation or workflow
7. The Pragmr Delivery Confidence Framework
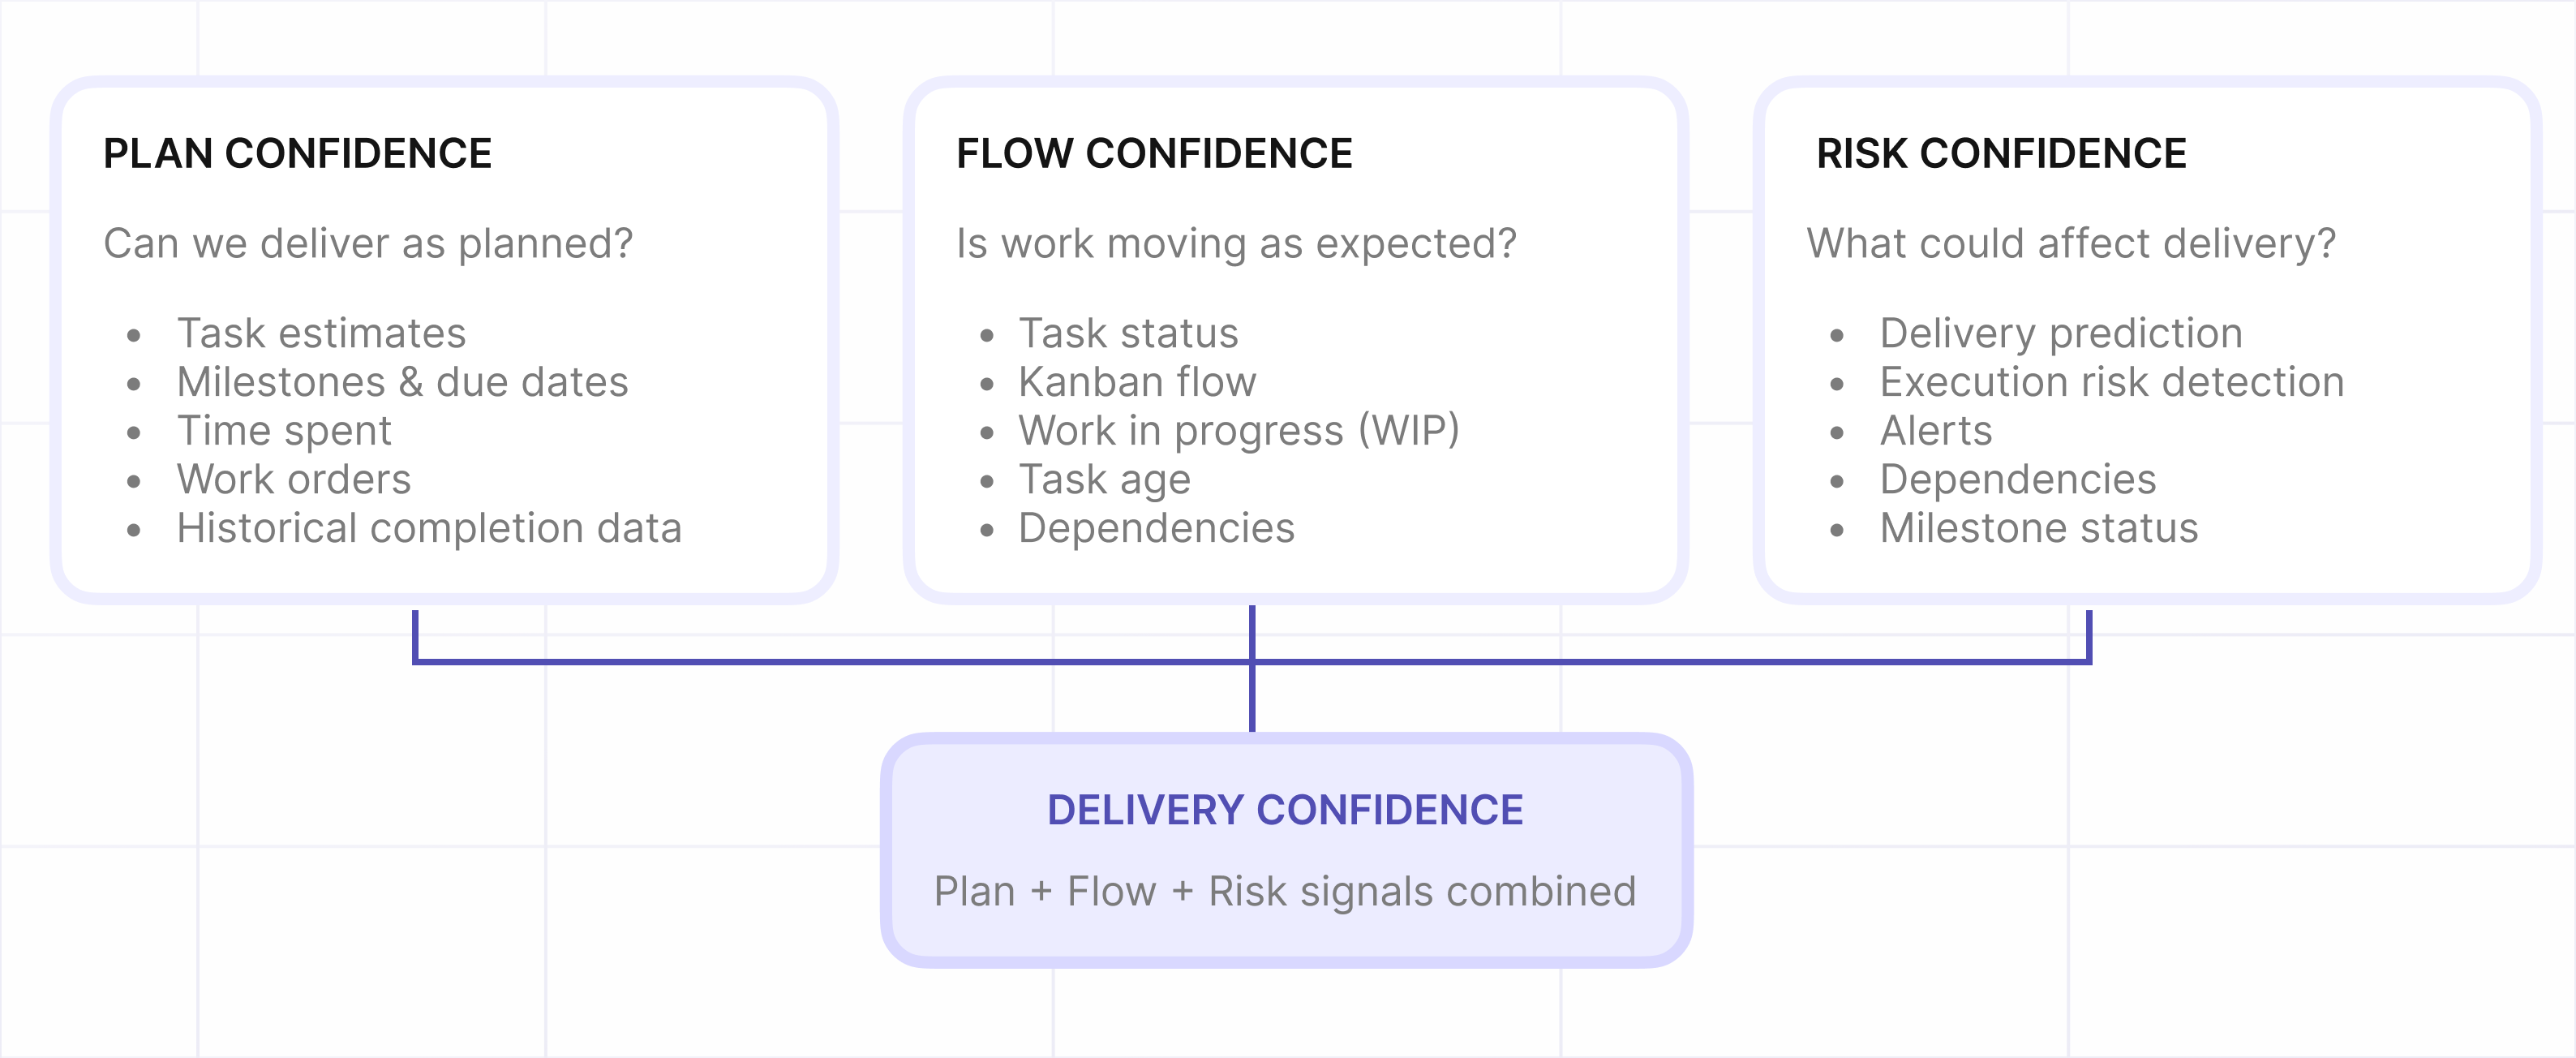
The Pragmr Delivery Confidence Framework helps teams with project performance measurement. It uses three connected lenses: Plan Confidence, Flow Confidence, and Risk Confidence.
- Plan Confidence checks if the project plan is realistic. It looks at task estimates, work orders, milestones, due dates, resource allocation, time spent, and past completion patterns.
- Flow Confidence checks if work is progressing smoothly through execution. It looks at signals like task status, Kanban flow, work in progress, task age, time spent, dependencies, and ETA.
- Risk Confidence checks if delivery threats are clear and monitored. It uses signals from dependencies, milestone status, and team-availability information.
These views help Pragmr OnTime shift teams from just tracking tasks. They provide a clearer, statistics-based picture of whether delivery will stay on track.
8. How Delivery Prediction Works
Pragmr OnTime uses everyday execution data to create a delivery forecast. It does this through a series of connected steps:
- Ingest execution data: Pulls events from Plans, Work Orders, Tasks, Kanban columns, Milestones, Calendars, Connect, and Meetings in real time
- Derive metrics: Converts raw events into key project performance indicators like throughput, WIP levels, task dependencies, and milestone history
- Statistical analysis: Uses direct calculations to compare historical data with past projects. This helps Pragmr OnTime estimate completion probabilities in its project analytics
- Alerts and timely action: Pragmr OnTime notifies the right reviewer or approver when action is needed. Helps reduce delays caused by pending reviews, approvals, or decisions, so blocked work can move forward sooner
9. What Data Drives Delivery Prediction?
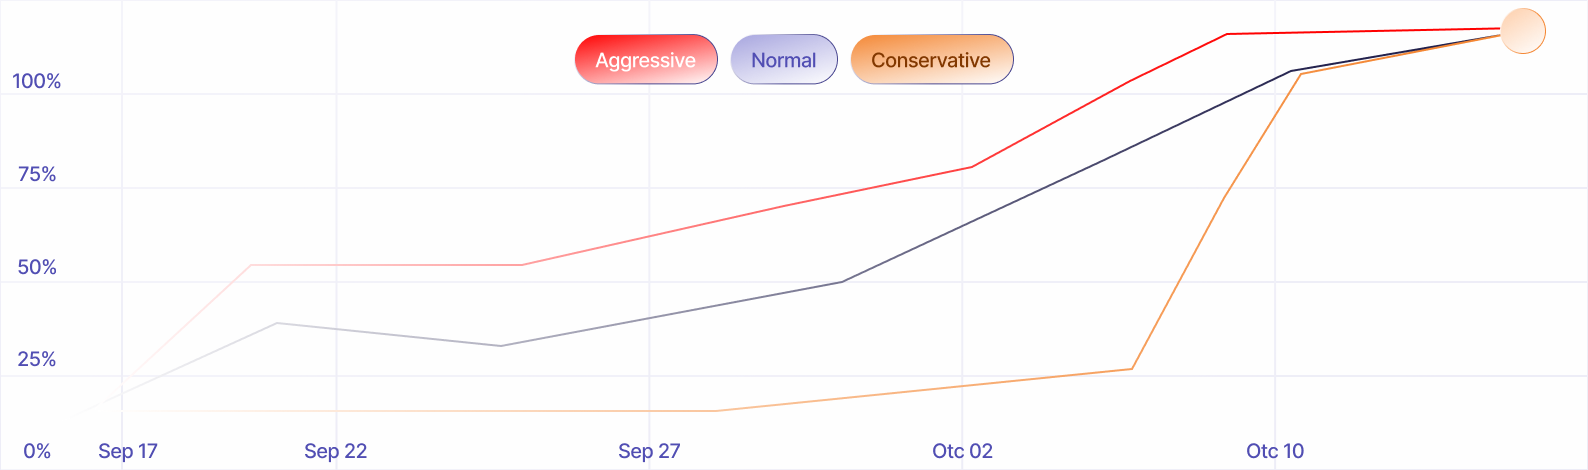
Pragmr OnTime builds each forecast from project data, team performance, and change signals. These are the core inputs behind every delivery prediction.
- Planned scope: The work promised, including milestones, work orders, tasks, priority, ETA, and target delivery date
- Completed and remaining work: How much work is done and how much is left, based on task status (new, assigned, in progress, and completed)
- Delivery performance history: How comparable tasks and work orders were delivered in the past, including completion pace, and rework patterns
- Current execution pace: Time spent compared to estimates, task progress, cycle time, work in progress, aging, and blocked tasks
- Team capacity: Hours available for work after considering current assignments, planned leave, meetings, parallel projects, and operational buffer hours
- Skill fit: Match between the assigned person's skills and the skills the work requires
- Changes and Risk signals: What may disrupt the plan, such as scope changes, reassignments, unexpected absence, and delayed dependencies
10. How to Measure Delivery Confidence
Delivery confidence is how likely you are to meet committed scope, date, quality, and cost expectations. It applies to a milestone or a plan.
A strong project performance evaluation does not rely on a single status update. It measures delivery confidence through a connected set of project performance indicators: schedule, progress, capacity, ownership, dependencies, execution, and risk.
Schedule Confidence:
Schedule confidence shows whether the expected completion date is realistic based on historical performance.
Track task and work-order status, actual progress, and estimated completion dates. When current pace differs from the plan, teams can identify schedule risk before the deadline is missed.
Progress Confidence:
Progress confidence measures how much committed work has actually been completed.
Use completed tasks and work orders to calculate real progress not subjective status labels. This helps teams distinguish genuine momentum from work that is simply in progress.
Capacity Confidence:
Capacity confidence shows whether the team has enough availability to complete its committed workload.
A Kanban view can make planned versus committed workload, remaining availability, and over-allocation risk visible. This turns workload management into a daily practice rather than a periodic review.
Skills & Ownership Confidence:
Skills and ownership confidence checks whether every task has the right owner and the right skills behind it.
Smart assignment can assess skill fit, recommend qualified alternatives, and flag unassigned work. This reduces the chance of work sitting idle because ownership or capability is unclear.
Dependency Confidence:
Dependency confidence measures whether upstream work, reviews, and approvals are moving smoothly.
Keep dependencies visible on the Kanban board and alert teams when reviews or approvals are pending. This stops waiting work from becoming a blocker.
Execution Confidence:
Execution confidence reveals how efficiently work is flowing through the team.
Monitor bottlenecks, task aging, task movement, and rework signals, because rising cycle time and stalled tasks are early signs of delivery risk.
Risk Confidence:
Risk confidence shows the overall chance that delivery will be disrupted.
So, teams can combine dependency status, milestone progress, team availability, and execution signals to find the risks that need attention first. Then, they can act early and avoid delivery delays.
11. What Should You Do When Delivery Risk Appears?
Regular project risk analysis helps teams identify the cause of a delivery risk. Therefore, they can take action before it affects the project.
Here is a simple way to respond:
- Triage the signal: Check the blocker in real time. Make sure the delay is real. It may just be a wrongly tagged task
- Identify the prime driver: Find the specific cause behind the block. Then update the real-time ETA. This way, the delivery forecast reflects the current delay, not the first estimate
- Unblock the flow: Try to clear the specific bottleneck first. For example, chase the stuck approval. Then adjust resource allocation so the blocked item can move again
- Adjust and re-plan: Teams can revise task priorities and resource allocation, then recalculate the forecast using current project data
12. Delivery Prediction Use Cases
Here are the ways teams use it:
Project risk analysis helps delivery leaders prioritize projects that need attention. Consequently, they can decide where corrective action is most urgent.
- Milestone risk forecasting: Estimate the chance of hitting a milestone or release date. The estimate uses current progress and capacity.
- Resource over-allocation detection: Spot people who work on too many projects. Catch it before it slows delivery.
- Portfolio-level prioritization: See which projects across a portfolio are most at risk. Then leaders can steer resource allocation and attention to where it matters most.
- Estimation calibration from historical data: Compare past results with first estimates. This makes plans more accurate over time.
13. How Pragmr OnTime Helps
Pragmr OnTime is a platform for work execution and delivery visibility. It helps make deliverables predictable right from the start. It is not an add-on analytics layer. The forecast is built from the work teams already do in Planner, Kanban, and Milestones, so predictions remain current without additional reports.
How Planner and Work Order Start the Process
It starts with the planner. Teams create a list of what they need to deliver. Then they divide the work into manageable tasks. They also provide a realistic path to completion. Teams can group related tasks into work orders. This helps teams see what work is needed for a specific request, deliverable, or project phase.
How Kanban, Smart Assign, and Milestones Track Delivery
As soon as execution begins, the Kanban Board shows how each task moves. Specifically, tasks go from planned work to in progress to done. Meanwhile, Smart Assign helps resource allocation by matching work to resource availability and skill fit. Therefore, this supports capacity planning while reducing the risk of overload or misalignment.
Finally, Milestones track whether the planned outcomes are being achieved at the expected points in time. They also show clear accountability for who owns each part of the deliverable.
Together, these modules link the plan to daily work. Teams can see what they planned and what is happening now. They can see where work is blocked. Most of all, they can tell if the project will meet its delivery promises.
ALTERNATIVES vs ONTIME
APPROACH | HOW IT WORKS | WHERE IT FALLS SHORT TODAY | HOW PRAGMR DIFFERS |
|---|---|---|---|
Manual EVM / Static Baselines | Plan once, track variance against the baseline | Brittle under scope change | Live plan, Task and workorder data |
Gantt Chart or expert judgement | Critical path plus manager intuition | Misses hidden queues, rework | Data driven risk drivers - Kanban and calendars |
Spreadsheet Monte Carlo | Simulate durations from manually entered estimates | Inputs go stale, rarely re-run once built | Automated features from real execution data |
Velocity alone | Track completed work per sprint | Ignores flow, WIP, dependencies | Flow based metrics |
ML Prediction | A model built and run periodically by a data team | Features go stale, no operational alerts or task ownership | Integrated ETA |
FAQ
Frequently Asked Questions
No, teams of any size can use it, because it works from the task and progress data your team already creates.
[ Prediction ]
See what your execution data says about your dates.
Tell us where to reach you — we'll show you a delivery prediction from your own work.